
B.C.'s Labour Market Outlook
Find out about projected job openings for the next 10 years to help you make informed decisions about your career.
Overview
Minister's message
The 2025 edition of the B.C. Labour Market Outlook offers a glimpse into the evolving future of work in British Columbia. It paints a picture of B.C.'s employment future, and it highlights key trends in labour supply and demand, helping both those looking for work and those hiring.
The Ministry of Post-Secondary Education and Future Skills is responsible for ensuring that the people of British Columbia have access to the skills and training they need to succeed in the labour market, both today and in the years to come. The B.C. Labour Market Outlook helps by pulling together data on people, jobs and industries to show what kinds of work will be in demand — to plan ahead and make smart decisions about training, education and careers.
The Labour Market Outlook predicts that there will be about one million job openings in the 10-year period from 2025 to 2035. It estimates that 3.3 million people will be working in B.C. in 2035, up from 2.9 million today. These one million job openings are the result of two factors: job vacancies as workers retire and new positions created by economic growth.
The 2025 Labour Market Outlook confirms many of the trends seen in previous Outlooks with strong growth in the tech and healthcare sectors. This latest Outlook reflects the federal changes to immigration levels, which are expected to result in slower population growth and supply fewer workers than previously expected. Of note, the Labour Market Outlook does not fully reflect the recent fast-tracking of major projects, and this is expected to lead to higher employment than projected in this Outlook.
This year’s Outlook assumes slightly slower economic growth than in the previous year, in part reflecting the uncertainty caused by tariffs. Some other uncertainties, like the speed with which artificial intelligence (AI) will impact the labour market, remain. Due to this, the B.C. Labour Market Outlook is revised annually to reflect changing circumstances.
One of the clear and consistent conclusions of the Labour Market Outlook is the value of post-secondary education and ensuring employers have the skills they need. This is why it’s so crucial to invest in post-secondary education and skills training. Over three-quarters of today’s jobs — and those of the next 10 years — will require higher levels of education beyond high school, be that an apprenticeship, a college diploma or a university degree.
Our post-secondary institutions are well-positioned to help individuals gain the skills and credentials they will need to thrive. We continue to work together with our post-secondary institutions, ensuring that people have access to education and skills training that is accessible, affordable and relevant to the needs of our changing economy.


Honourable Jessie K. Sunner
Ministry of Post-Secondary Education and Future Skills
About the B.C. Labour Market Outlook
The 2025 edition of the B.C. Labour Market Outlook (“Outlook”) is a 10-year forecast covering the period from 2025 to 2035. It provides an estimate of future labour supply for B.C. by occupation, as well as labour demand by industry, occupation, education and training, and development region. It also identifies which occupations will offer the most opportunity, as well as the level of education and training that each occupation typically requires.
It is intended for students, job seekers and those considering a career change, and it will also be of value for educators, planners, employers and governments. The Outlook also plays a role in making the B.C. labour market more inclusive by providing Indigenous communities with access to information about labour demand, both across the province and within the regions where they live. It can help those who are underrepresented in the labour market — people of colour, immigrants, women and individuals living with disabilities — learn about the opportunities available to them.

B.C. Labour Market Outlook: 2025 Edition
Review the B.C. Labour Market Outlook: 2025 Edition forecast in the complete report (PDF).
How reliable is the Labour Market Outlook?

The Labour Market Outlook has been published nearly every year since 2011 and uses the most reliable, relevant and up-to-date data from sources that include BC Stats, the B.C. Ministry of Finance, Statistics Canada and other federal departments. Employers, unions, industry groups and post-secondary institutions were also consulted to test the validity of these projections.
However, the Labour Market Outlook is a forecast and is not intended to be interpreted as a definitive prediction about what will happen in the future. The Outlook, like other labour market projections, should instead be understood as a tool for investigating what the labour market might look like in the years ahead according to various assumptions about possible future change. The accuracy of the projections depends on several factors. Some events — like economic crises, pandemics and natural catastrophes — are difficult to anticipate and can affect the growth and composition of the labour market. For this reason, the ministry revises the labour market forecasts on a regular basis to take into account changing circumstances.
To learn more about the specialized economic modelling system and how this forecast was developed, visit the Definitions and Methodology Tab.
What are the major changes in this edition?
The most significant change in this year’s forecast stems from an updated immigration outlook, based on the Federal Immigration Levels Plan released in November 2024. This plan reduced Canada’s target for permanent residents from 500,000 to 395,000 for 2025, with further declines anticipated in 2026 and 2027. In addition, temporary residents were capped at 5 percent of the total population, suggesting a substantial outflow in the coming years. Total refugee and protected admissions targets were also lowered, adding to the reduction. This change weakens population growth to 0.9 percent per year from 1.6 percent in the previous Outlook.
The Outlook incorporates slower expected growth than the previous forecast — reflecting in part the economic uncertainty posed by tariffs. Nearly 14 percent of all businesses in British Columbia, whether they are engaged in trade or not, anticipate that the imposition of tariffs by the United States on imports from Canada would have a high level of impact on their business. It is also assumed that the softwood lumber, steel and aluminum sectors could face additional risks should the tariffs remain in place. However, the production ramp-up at LNG Canada and increased efforts to diversify trade will to some extent offset slower trade activity in other areas.
Weaker population growth, because of slowing immigration, will reduce household formation and in turn investment in new homes. Housing starts are expected to average 49,000 per year over the forecast period, down slightly from the previous forecast, which will somewhat temper growth in the construction industry.
Highlights
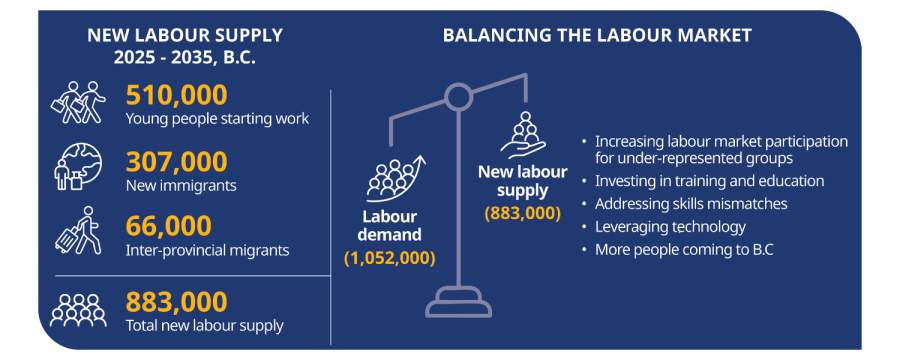
Over the next decade (2025–2035), it is projected that there will be 1,052,000 job openings in British Columbia. This is about 70,000 fewer job openings than projected in the 2024 edition of the Outlook, mainly due to a slower population forecast in this year’s report. Employment is expected to reach 3.3 million by 2035 (an annual average growth rate of 1.2 percent).
As B.C.’s population ages over the next decade, we anticipate there will be 687,000 job openings to replace retiring workers (65 percent of the total). The remaining 35 percent of the 10-year total job openings — 365,000 new jobs — will be created through economic growth. Filling these future job openings will involve multiple sources of labour supply:
- Immigration is expected to supply less than a third of the new workers B.C. is expected to need over the next 10 years. This is a large decline from the 2024 Outlook, when it was assumed that immigration would supply almost half of all new workers over the 10-year forecast period.
- Over the next decade, approximately 510,000 young people are expected to enter the labour force for the first time — 14,000 fewer than projected in the 2024 Outlook. This decline is primarily driven by reduced immigration to B.C., as newcomers tend to be younger and often arrive with families whose children eventually join the labour market.
- Workers from other parts of Canada are expected to account for 6 percent.
The 2025 edition of the Outlook forecasts that over the next 10 years labour demand will outpace labour supply. This difference can be resolved though supply-side measures like increasing labour market participation, attracting more people to B.C. or future increases in immigration levels. It could also be resolved through demand-side measures like greater reliance on artificial intelligence (AI) and automation. Most importantly, if workers lack the education, skills and training to meet the labour market demands of tomorrow, future employment growth will be slower than anticipated. Therefore, ensuring that workers have the skills that match the opportunities in an evolving labour market is key to ensuring high employment.
Education and Training
TEER
Canada’s National Occupational Classification (NOC) system uses the TEER framework — Training, Education, Experience and Responsibilities — to better reflect the qualifications required across today’s workforce. The system organizes jobs into six levels, from TEER 0 (management and leadership roles) to TEER 5 (positions requiring no formal education), offering a practical lens through which to forecast the country’s labour needs.
B.C. anticipates 1,052,000 job openings over the next decade, with 77 percent (811,400 positions) falling within TEERs 0 to 3. These roles typically demand post-secondary education, specialized training or demonstrated leadership experience. That is up one percentage point from the previous forecast (76 percent), underscoring a continued shift toward careers requiring advanced credentials and transferable skills. Meanwhile, TEERs 4 and 5 represent 23 percent of projected openings (240,600) and serve as critical entry points — especially for newcomers, youth and career shifters entering foundational support positions. To keep pace, educators, policymakers and employers will need to align programs and hiring practices with evolving market needs, while students and job seekers should focus on career paths that emphasize transferable skills and long-term growth.
| Training, Education, Experience and Responsibilities | Job Openings | % of Total | |
|---|---|---|---|
| Training, Education, Experience and Responsibilities | TEER 0 Management | 166,400 | 15.8% |
| Training, Education, Experience and Responsibilities | TEER 1 University degree | 235,300 | 22.4% |
| Training, Education, Experience and Responsibilities | TEER 2 College or apprenticeship (two or more years) | 228,400 | 21.7% |
| Training, Education, Experience and Responsibilities | TEER 3 College or apprenticeship (less than two years) | 181,300 | 17.2% |
| Training, Education, Experience and Responsibilities | TEER 4 Secondary school | 127,300 | 12.1% |
| Training, Education, Experience and Responsibilities | TEER 5 No formal education | 113,300 | 10.8% |
Skills grouping
In British Columbia, work is evolving under the influence of technological and demographic shifts. Automation and artificial intelligence (AI) are reshaping how tasks are performed, while an aging population and growing emphasis on diversity and inclusion are transforming the workforce. Identifying the skills needed for future jobs is critical to helping job seekers and employers adapt to changing economic and labour market conditions. This insight also supports educators and policymakers in creating programs that prepare the workforce for success over the next decade. Previous reports explored demand for specific skills (2022 LMO) and occupational clusters based on skill profiles (2023 LMO).
In this edition of the Outlook, 35 different skills were analyzed and bundled into five skills groups based on occupation and level of competency required. By linking these groups to future job openings, a more interpretable and actionable framework for understanding future skills demand is offered. Refer to Definitions and Methodology for more information.
- Foundational: Active learning, active listening, complex problem solving, critical thinking, instructing, judgement and decision making, learning strategies, reading comprehension, speaking, systems analysis, systems evaluation and writing
- Social: Negotiation, persuasion, service orientation and social perceptiveness
- Management: Coordination, management of financial resources, management of material resources, management of personnel resources, monitoring and time management
- Science & Engineering: Mathematics, operations analysis, programming, science and technology design
- Technical: Equipment maintenance, equipment selection, installation, operation and control, operations monitoring, quality control analysis, repairing and troubleshooting
Future skills demand
The skills in group one were found to be either important or moderately important across all future job openings. This skill group includes foundational abilities such as active listening, reading comprehension and writing, which tend to be highly rated across many occupations. It also encompasses cognitive skills like critical thinking, complex problem solving, and judgment and decision making, which are similarly valued across diverse roles.
Some level of competency in social (group two) and management (group three) skills is also required across nearly all occupations. Social skills are rated as either important or moderately important in 63 percent and 36 percent of projected job openings, while management skills are important in 36 percent of future job openings and moderately important in 64 percent.
In contrast, skills in science and engineering (group four) and technical fields (group five) are considered important in less than five percent of projected job openings, and are moderately important in 22 percent and 16 percent, respectively. While these skills are relevant to fewer occupations, they are often tied to highly specialized roles — such as software engineers and designers, chemical engineers and aerospace engineers. These roles tend to be well-compensated and in high demand, with many classified as High Opportunity Occupations. However, these areas require higher levels of technical training and skills development.
B.C. Labour Market Outlook: 2025 Edition
Review the B.C. Labour Market Outlook: 2025 Edition forecast in the complete report (PDF).
Industry Outlook
Industry overview

Over the next decade, five major industries will generate more than half (58 percent) of the job openings in British Columbia:
- Health care and social assistance (199,200 job openings; 19 percent of total)
- Professional, scientific and technical services (162,200 job openings; 15 percent of total)
- Retail trade (100,900 job openings; 10 percent of total)
- Construction (87,300 job openings; 8 percent of total)
- Finance, insurance and real estate (64,700 job openings; 6 percent of total)
Apart from health care and social assistance and professional, scientific and technical services, the need to replace retiring workers will account for more than half of the job openings in all major industries over the next 10 years.
| Industry | Expansion | Replacement | Total Job Openings | |
|---|---|---|---|---|
| Industry | Health care and social assistance | 100,800 | 98,400 | 199,200 |
| Industry | Professional, scientific and technical services | 88,200 | 74,000 | 162,200 |
| Industry | Retail trade | 30,400 | 70,500 | 100,900 |
| Industry | Construction | 28,100 | 59,200 | 87,300 |
| Industry | Finance, insurance and real estate | 18,600 | 46,100 | 64,700 |
| Industry | Educational services | 6,300 | 51,800 | 58,100 |
| Industry | Public administration | 12,400 | 40,500 | 52,900 |
| Industry | Manufacturing | 5,600 | 44,500 | 50,200 |
| Industry | Transportation and warehousing | 11,600 | 38,600 | 50,200 |
| Industry | Accommodation and food services | 16,300 | 33,500 | 49,800 |
Industry insights
Health care and social assistance
Projected to generate the highest number of job openings in British Columbia. Ambulatory health care services specifically, which includes outpatient medical services, is forecast to grow at an annual rate of 2.3 percent, outpacing overall growth within this sector.
Professional, scientific and technical services
Rapid technological advancement is fueling demand in this sector, particularly within the computer systems design and related services sub-industry. This sector is projected to grow at an annual rate of 4.2 percent — significantly faster than the overall industry growth rate of 2.4 percent.
Retail trade
Retail is a vital component of British Columbia’s economy, particularly in urban centers like Vancouver and Victoria. The growing importance of e-commerce and digital retail strategies will also drive demand for workers skilled in logistics, digital marketing and customer service as traditional retail models continue to evolve.
Construction
British Columbia continues to see significant investments in infrastructure projects, housing developments and commercial real estate, particularly in urban areas like Metro Vancouver. The provincial government’s focus on affordable housing, transportation infrastructure and green building initiatives will continue to fuel demand in this sector. While the construction industry is sensitive to economic fluctuations, the ongoing need for infrastructure renewal and new housing ensures a steady demand for skilled tradespeople, engineers and project managers.
Finance, insurance and real estate
Technological innovation, regulatory changes and evolving consumer expectations are reshaping roles across banking, insurance and property services. This creates sustained demand for financial advisors, underwriters, real estate professionals and compliance specialists. The sector is undergoing rapid digitalization, increasing the need for workers skilled in data analysis, cybersecurity and digital client services.
B.C. Labour Market Outlook: 2025 Edition
Review the B.C. Labour Market Outlook: 2025 Edition forecast in the complete report (PDF).
Occupational Outlook
Occupational overview
Within the NOC 2021 system, occupations are divided into 10 broad occupational categories. Some of these occupational categories are forecasted to have stronger growth than others, with the top five occupational categories forecasted to have nearly 80 percent of all job openings in B.C. from 2025–2035:
- Sales and service occupations (219,200 job openings; 21 percent of the total)
- Business, finance and administration occupations (196,200 job openings; 19 percent of the total)
- Trades, transport and equipment operators and related occupations (168,300 job openings; 16 percent of the total)
- Education, law and social, community and government services occupations (120,800 job openings; 11 percent of the total)
- Natural and applied sciences and related occupations (118,900 job openings; 11 percent of the total)
As shown in the figure below, replacement job openings will outpace expansion job openings in all broad occupational categories except natural and applied sciences and related occupations and health occupations. These 10 broad occupational categories can be further broken down into 512 specific occupations (see Appendix 4 of the PDF report).
| Occupational Group | Expansion | Replacement | Total Job Openings | |
|---|---|---|---|---|
| Occupational Group | Sales and service | 71,000 | 148,100 | 219,200 |
| Occupational Group | Business, finance and administration | 62,700 | 133,500 | 196,200 |
| Occupational Group | Trades, transport and equipment operators and related | 46,500 | 121,800 | 168,300 |
| Occupational Group | Education, law and social, community and government services | 36,800 | 84,000 | 120,800 |
| Occupational Group | Natural and applied sciences and related | 60,600 | 58,200 | 118,900 |
| Occupational Group | Health | 58,200 | 58,100 | 116,300 |
| Occupational Group | Art, culture, recreation and sport | 17,100 | 25,500 | 42,600 |
| Occupational Group | Manufacturing and utilities | 4,700 | 28,100 | 32,800 |
| Occupational Group | Legislative and senior management | 5,900 | 16,500 | 22,400 |
| Occupational Group | Natural resources, agriculture and related production | 1,200 | 13,500 | 14,700 |
High opportunity occupations

High Opportunity Occupations (HOO) are roles forecasted to offer greater career prospects over the next decade. These occupations are expected to face tighter labour market conditions, experience higher demand relative to supply, provide competitive wages and present strong long-term opportunities. Each edition of the Labour Market Outlook updates the list of HOOs to reflect current trends and future projections, helping individuals make informed career decisions based on the latest information.
A consistent theme across the HOO list is the critical role of education and training. Every occupation identified in this year’s list falls under TEER categories 0, 1, 2 or 3, indicating that they require either management-level experience or some form of post-secondary education and training. In addition, the 125 HOOs (out of the 512 total occupations) collectively account for 40 percent of projected job openings over the next 10 years.
This edition of the Outlook also includes an update to the HOO methodology to ensure its relevance and credibility. The update addresses occupations with a higher share of older workers nearing retirement and adjusts the weights of other indicators. Review the Definitions and Methodology tab to learn more.
For a complete list of all HOO occupations, see High Opportunity Occupations or Appendix 5 in the 2025 Labour Market Outlook report (PDF).
B.C. Labour Market Outlook: 2025 Edition
Review the B.C. Labour Market Outlook: 2025 Edition forecast in the complete report (PDF).
Regional Outlook
The demographics and economies of B.C.’s seven development regions reflect both shared characteristics and distinct differences. As a result, each region is expected to offer diverse employment opportunities across a range of industries, which are highlighted under their own individual sections below.
Employment and Job Openings by Development Region, B.C. (2025-2035)
Total of regions may not sum to the B.C. total due to rounding.

| Region | Employment (2025) | Annual Employment Growth Rate (2025-2035) | Job Openings (2025-2035) | |||
|---|---|---|---|---|---|---|
| Expansion | Replacement | Total | ||||
| Regions | Vancouver Island/Coast | 471,500 | 1.3% | 64,800 | 123,800 | 188,600 |
| Regions | Mainland/Southwest | 1,906,100 | 1.3% | 260,900 | 419,100 | 680,000 |
| Regions | Thompson-Okanagan | 308,500 | 0.9% | 28,400 | 82,100 | 110,500 |
| Regions | Kootenay | 85,700 | 0.5% | 4,100 | 22,700 | 26,800 |
| Regions | Cariboo | 82,600 | 0.3% | 2,200 | 19,500 | 21,700 |
| Regions | Northeast | 36,800 | 0.5% | 1,900 | 8,800 | 10,700 |
| Regions | North Coast and Nechako | 46,200 | 0.5% | 2,500 | 11,200 | 13,700 |
| British Columbia | 2,937,000 | 1.2% | 365,000 | 687,000 | 1,052,000 | |
Vancouver Island/Coast
A total of 188,600 job openings are projected for the Vancouver Island/Coast region over the next decade. Most of these openings (66 percent) will come from replacement demand, primarily due to retirements, while the remaining 34 percent will result from economic growth. Employment across all industries in the region is expected to grow at an annual rate of 1.3 percent, slightly outperforming employment growth at the provincial level.
| Key project to watch Brewster Wind Project in Campbell River, a $600 million plus investment that will employ up to 275 workers during peak construction. |
| Industry | Employment (2025) | Annual Employment Growth Rate (2025-2035) | Job Openings (2025-2035) | |||
|---|---|---|---|---|---|---|
| Expansion | Replacement | Total | ||||
| Industry | All industries | 471,500 | 1.3% | 64,800 | 123,800 | 188,600 |
| Industry | Other retail trade (excluding cars and personal care) | 43,700 | 1.3% | 6,400 | 10,100 | 16,500 |
| Industry | Hospitals | 29,400 | 2.1% | 6,800 | 7,400 | 14,200 |
| Industry | Ambulatory health care services | 21,000 | 2.4% | 5,800 | 5,700 | 11,500 |
| Industry | Legal, accounting, design, research and advertising services | 18,600 | 2.5% | 5,300 | 5,100 | 10,400 |
| Industry | Nursing and residential care facilities | 15,800 | 2.7% | 5,100 | 4,100 | 9,200 |
Mainland/Southwest
Over the next decade, about 680,000 job openings are projected across all industries in the Mainland/Southwest region. About 62 percent of these opportunities will come from replacing workers who are mostly retiring, with the other 38 percent representing new jobs generated by economic growth, which is a relatively higher share compared to other regions. Employment demand in the Mainland/Southwest is projected to grow at an average annual rate of 1.3 percent between 2025 and 2035, aligning with the region’s anticipated population growth over the same period.
| Key project to watch The Roberts Bank Terminal 2 Expansion, a major infrastructure project with an estimated capital cost of $3.5 billion. Job estimates for the project have been updated recently, and this forecast is likely to underestimate its full impact. |
| Industry | Employment (2025) | Annual Employment Growth Rate (2025-2035) | Job Openings (2025-2035) | |||
|---|---|---|---|---|---|---|
| Expansion | Replacement | Total | ||||
| Industry | All industries | 1,906,100 | 1.3% | 260,900 | 419,100 | 680,000 |
| Industry | Computer systems design and related services | 94,900 | 4.4% | 52,400 | 22,700 | 75,100 |
| Industry | Other retail trade (excluding cars and personal care) | 160,800 | 1.0% | 17,400 | 32,600 | 50,000 |
| Industry | Hospitals | 95,800 | 2.2% | 23,600 | 20,800 | 44,500 |
| Industry | Ambulatory health care services | 80,500 | 2.3% | 21,300 | 17,500 | 38,800 |
| Industry | Specialty trade contractors | 81,800 | 1.4% | 12,600 | 16,800 | 29,400 |
Thompson–Okanagan
Job openings in the Thompson–Okanagan region are projected to total 110,500 over the next 10 years. Roughly 74 percent will result from replacing primarily retiring employees, while 26 percent will be brand new roles driven by economic expansion. Employment demand is expected to grow at an average annual rate of 0.9 percent, slightly outpacing the region’s projected population growth of 0.5 percent per year during the same period.
| Key project to watch Highland Valley Mine Life Extension, a proposed copper and molybdenum mine life extension with an estimated capital cost of $2.4 billion. |
| Industry | Employment (2025) | Annual Employment Growth Rate (2025-2035) | Job Openings (2025-2035) | |||
|---|---|---|---|---|---|---|
| Expansion | Replacement | Total | ||||
| Industry | All industries | 308,500 | 0.9% | 28,400 | 82,100 | 110,500 |
| Industry | Other retail trade (excluding cars and personal care) | 29,100 | 0.6% | 1,700 | 6,800 | 8,500 |
| Industry | Hospitals | 14,900 | 2.2% | 3,700 | 4,000 | 7,700 |
| Industry | Specialty trade contractors | 19,400 | 0.7% | 1,400 | 5,500 | 6,900 |
| Industry | Ambulatory health care services | 12,600 | 2.1% | 3,000 | 3,500 | 6,500 |
| Industry | Legal, accounting, design, research and advertising services | 10,600 | 2.5% | 3,100 | 2,800 | 5,900 |
Kootenay
A total of 26,800 job openings are forecast for the Kootenay region over the next 10 years. Approximately 85 percent of these openings will result from replacement demand reflecting the region’s aging population — 28 percent of the population will be 65 years or older by 2035 — while the remaining 15 percent will be driven by economic growth. Employment demand is projected to grow at an average annual rate of 0.5 percent, closely aligning with the region’s anticipated population growth of 0.4 percent between 2025 and 2035.
| Key project to watch Fording River Extension (Castle), a proposed project to extend the lifespan of the Fording River Operations with an estimated capital cost of $4.45 billion. |
| Industry | Employment (2025) | Annual Employment Growth Rate (2025-2035) | Job Openings (2025-2035) | |||
|---|---|---|---|---|---|---|
| Expansion | Replacement | Total | ||||
| Industry | All industries | 85,700 | 0.5% | 4,100 | 22,700 | 26,800 |
| Industry | Other retail trade (excluding cars and personal care) | 8,100 | 0.6% | 500 | 1,900 | 2,400 |
| Industry | Ambulatory health care services | 4,200 | 2.2% | 1,000 | 1,200 | 2,200 |
| Industry | Mining | 6,600 | 0.5% | 300 | 1,800 | 2,200 |
| Industry | Hospitals | 4,000 | 2.2% | 1,000 | 1,000 | 2,000 |
| Industry | Elementary and secondary schools | 4,300 | 0.4% | 200 | 1,300 | 1,400 |
Cariboo
A total of 21,700 job openings are projected for the Cariboo region over the next decade. Around 90 percent will stem from the replacement of mostly retiring workers, while 10 percent will be newly created jobs due to growth in the economy. Employment demand across all industries is expected to grow modestly at an average annual rate of 0.3 percent between 2025 and 2035, slightly outpacing the region’s projected population decline of 0.1 percent over the same period.
| Key project to watch Cariboo Gold Project, a proposed underground gold mining operation with an estimated capital cost of $918 million. |
| Industry | Employment (2025) | Annual Employment Growth Rate (2025-2035) | Job Openings (2025-2035) | |||
|---|---|---|---|---|---|---|
| Expansion | Replacement | Total | ||||
| Industry | All industries | 82,600 | 0.3% | 2,200 | 19,500 | 21,700 |
| Industry | Hospitals | 6,400 | 1.6% | 1,100 | 1,500 | 2,600 |
| Industry | Other retail trade (excluding cars and personal care) | 8,000 | 0.4% | 300 | 1,700 | 2,000 |
| Industry | Specialty trade contractors | 4,200 | 0.6% | 300 | 1,000 | 1,300 |
| Industry | Ambulatory health care services | 2,400 | 2.2% | 600 | 600 | 1,200 |
| Industry | Personal, non-automotive repair and non-profit services | 2,700 | 1.3% | 400 | 600 | 1,000 |
Northeast
The Northeast region is projected to generate 10,700 job openings over the next decade. Approximately 82 percent will arise from vacancies left by primarily retiring workers, with the remaining 18 percent accounting for new positions created by growth in the economy. Employment demand is expected to grow at an average annual rate of 0.5 percent, compared to a projected population decline of 0.1 percent. Ongoing interregional and interprovincial worker mobility may help support labour supply amid demographic change.
| Key project to watch Aspen Point Program, a $1.2 billion natural gas pipeline to increase the capacity of the Westcoast natural gas pipeline system. |
| Industry | Employment (2025) | Annual Employment Growth Rate (2025-2035) | Job Openings (2025-2035) | |||
|---|---|---|---|---|---|---|
| Expansion | Replacement | Total | ||||
| Industry | All industries | 36,800 | 0.5% | 1,900 | 8,800 | 10,700 |
| Industry | Other retail trade (excluding cars and personal care) | 3,100 | 1.4% | 500 | 700 | 1,200 |
| Industry | Mining | 1,400 | 2.2% | 400 | 400 | 800 |
| Industry | Oil and gas extraction | 2,100 | 0.6% | 100 | 600 | 700 |
| Industry | Elementary and secondary schools | 1,700 | 0.2% | 0 | 500 | 500 |
| Industry | Support activities for mining and oil and gas extraction | 1,500 | 0.7% | 100 | 400 | 500 |
North Coast and Nechako
The North Coast and Nechako region is projected to see 13,700 job openings over the next 10 years. Of the total, close to 82 percent will be replacement positions for workers, while the remaining 18 percent will be new roles arising from economic development. Employment demand is expected to grow modestly at an average annual rate of 0.5 percent, while the region’s population is projected to decline by 0.5 percent over the same period.
| Key projects to watch Red Chris Mine expansion with an estimated capital cost of $2.6 billion and the Baptiste Nickel project with an estimated capital cost of $2.8 billion. |
| Industry | Employment (2025) | Annual Employment Growth Rate (2025-2035) | Job Openings (2025-2035) | |||
|---|---|---|---|---|---|---|
| Expansion | Replacement | Total | ||||
| Industry | All industries | 46,200 | 0.5% | 2,500 | 11,200 | 13,700 |
| Industry | Other retail trade (excluding cars and personal care) | 3,600 | 0.9% | 300 | 800 | 1,100 |
| Industry | Ambulatory health care services | 1,600 | 2.5% | 500 | 400 | 900 |
| Industry | Ports and freight transportation arrangement | 1,500 | 2.4% | 400 | 400 | 800 |
| Industry | Forestry, logging and support activities | 1,500 | 1.3% | 200 | 400 | 600 |
| Industry | Rail transportation and support activities | 500 | 5.5% | 400 | 200 | 600 |
B.C. Labour Market Outlook: 2025 Edition
Review the B.C. Labour Market Outlook: 2025 Edition forecast in the complete report (PDF).
Featured Topics
Artificial intelligence and impact on employment

In previous Labour Market Outlooks, we have included information on which occupations may be most exposed to the impacts of artificial intelligence (AI) and automation. The potential impacts on labour demand are both positive (creation of new opportunities) and negative (reduction in demand for some occupations or skills).
The Canadian Survey of Business Conditions reports that most businesses do not report dramatic changes in the tasks performed by employees, and more than nine in 10 report no impacts on employment. Of those reporting employment impacts, there is a mix of those seeing employment rise and those seeing employment fall.
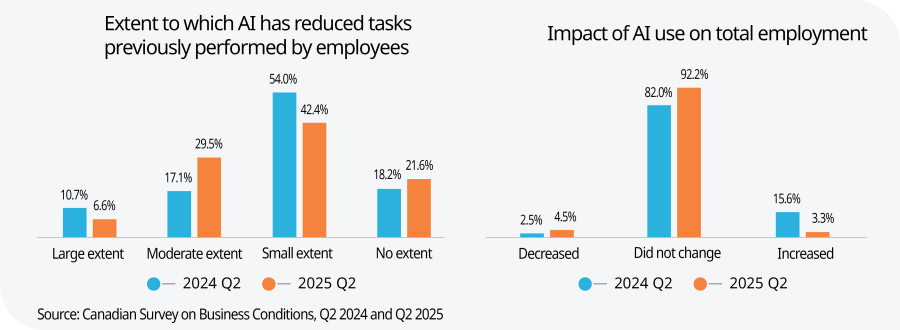
Although the overall impact appears restrained, certain sub-sectors or industries may be undergoing more pronounced changes that are not reflected in aggregate data. The Canadian Survey on Business Conditions reveals significantly higher rates of AI software adoption in sectors such as information, culture and recreation and professional, scientific and technical services. In contrast, adoption remains low in industries like agriculture, accommodation and food services and transportation.
Some media reports continue to focus on the impacts of AI on the outlook for jobs in the tech sector. Labour market data suggests that employment in areas like computer systems design and related services continues to have a strong outlook. Current labour market dynamics suggest some firms may be adjusting workforces in a period of slower economic growth following unprecedented increases in employment during the early part of the pandemic. More broadly, slower economic growth has reduced vacancies across many sectors resulting in increased challenges for job seekers, particularly younger ones.
Although the overall impact of AI on employment levels has been relatively limited to date, the pace and breadth of ongoing technological change — affecting both job numbers and skill requirements — remains a key uncertainty throughout the Labour Market Outlook time period.
| Will AI make it easier to find jobs in the future? A recent study showed that AI could facilitate job-matching methods for retirees who want to return to work, new immigrants and displaced workers. It could also enhance labour force participation of persons with disabilities through a variety of means such as facilitating workplace accommodations by matching employees with assistive technologies. AI could also reduce labour and skills shortages by improving labour market information and systems that match the skills needed by employers with those possessed by workers. |
Changes in agriculture and the food economy

Formed in early 2025, the Premier’s Task Force on Agriculture and Food Economy is dedicated to tackling key sector challenges and delivering prioritized, actionable recommendations to government. Its goal is to provide a clear roadmap for addressing current issues while shaping a measurable, long-term vision for growth and competitiveness.
The 2025 Labour Market Outlook forecasts a decline in new job creation within the agriculture and fishing industry, marking a shift from the modest growth forecasted in 2024. However, job openings due to replacements are expected to rise over the next decade, driven by an aging workforce. The analysis is further complicated by the sector’s heavy reliance on temporary foreign workers — who may not be fully captured in the statistical data used to develop the Outlook. As a result, job openings in the sector may be underestimated.
Agriculture in B.C., particularly in fruit picking and greenhouse operations, relies heavily on migrant labour for seasonal work. As immigration levels and policies change, the industry may face growing challenges in an increasingly tight labour market. Automation (e.g., robotic harvesters, drones) could reduce labour demands, especially in harvesting. However, technology for optimizing water, fertilizers and crop management may create new opportunities for skilled workers in tech and agri-tech fields.
The Outlook is forecasting an expansion in the food, beverage and tobacco manufacturing industry with 3,700 new jobs expected over the next 10 years. It is one of the fastest growing segments of the manufacturing sector and reflects the wide range of value-added food and beverage products made in British Columbia.
Understanding wage data: why it matters and how it’s calculated
Wages provide valuable insight into the health of the job market and can aid students and job seekers in making decisions about future careers (explore Career Profiles to learn more). However, to develop a clear understanding of how different occupations compare, both hourly wage and annual salary information are needed.
For many occupations, hourly wage data comes from sources such as the Labour Force Survey (LFS), the 2021 Census and Employment Insurance records. However, for certain roles — such as lawyers or specific healthcare professions — hourly data is either unavailable or impractical due to irregular work hours. In these cases, annual salary data is used instead. To facilitate comparisons, hourly wages are often converted into annual salaries. A common approach is to multiply the hourly wage by 40 hours per week and then by 52.14 weeks per year. For example, if a receptionist earns $22 per hour, the estimated annual salary would be $45,883.
Not all workers, however, put in exactly 40 hours each week. Some occupations are more likely than others to see a prevalence of part-time work, while others are more likely to regularly feature overtime. To improve accuracy, salary estimates in this edition of the Labour Market Outlook incorporate data on the average number of usual hours worked per week for each occupation. This can significantly alter results. For example, boilermakers and truck drivers often work more than 40 hours, increasing their estimated annual salaries, while architects and journalists usually work fewer hours, reducing their estimated annual salaries.
Incorporating additional information on hours worked is not without its challenges. Where information availability is limited, Census data is used that may not perfectly align with newer labour market information. The incorporation of average usual hours worked provides a general insight into salaries across occupations, but such a measure does not fully capture the range of work opportunities (whether full-time or part-time) available in occupations.
Data provided in the BC Data Catalogue provides salary data based on both a 40-hour work week and the average usual number of hours worked for each occupation. In summary, while every effort is made to provide accurate and useful wage information, it is important to recognize the limitations and variations in how this data is collected and calculated.
Major projects in the Labour Market Outlook

The Labour Market Outlook takes into account construction projects outlined in the B.C. Major Projects Inventory that are considered to have a high probability of proceeding and align with the B.C. Ministry of Finance’s economic forecast. As such, each regional outlook is based on recent historical trends in employment and major projects that have either started construction or are very close to starting.
This Outlook incorporates only one (Cedar LNG) of the 18 resource projects that have been fast-tracked as of February 2025. Since many of these projects were still in the proposal stage during the development of the 2025 Outlook, they were not advanced far enough to be included in the final forecast. These major projects will continue to be monitored and, as they move forward and will be integrated into future editions of the Labour Market Outlook.
In the Regional Outlook tab, we note some key projects that, if they proceed, may have significant labour market impacts not explicitly included in this year's Outlook.
B.C. Labour Market Outlook: 2025 Edition
Review the B.C. Labour Market Outlook: 2025 Edition forecast in the complete report (PDF).
Definitions and Methodology
Definitions
Annual employment growth rate: Calculated as the compound annual growth rate.
Changes in participation and unemployment: The change in the number of labour force participants (in addition to young people starting work, immigrants and migrants from other provinces or territories) and the change in the number of unemployed workers.
Employment: The number of employed workers.
Immigrants: Net immigration of persons moving to British Columbia from outside of Canada.
Inter-occupational mobility: The movement of workers to switch occupations.
Job openings — expansion: Job openings that arise due to economic growth.
Job openings — replacement: Job openings generated by a permanent exit from the labour force, including exits due to retirement, illness, disability, death and other reasons.
Job openings — total: The total number of expansion job openings and replacement job openings.
Labour demand: The number of employed people plus unfilled positions.
Labour supply: The labour force, including those already working and those actively looking for work.
Migrants from other provinces: Net in-migration from persons moving to British Columbia from other provinces and territories in Canada.
Young people starting work: Persons 17 to 29 years old entering the labour force for the first time after graduating from or leaving the education system.
Forecasting model methodology
The British Columbia Labour Market Outlook forecasting model is a labour market forecasting system that generates 10-year projections of labour demand and supply, covering 63 industries and 512 occupations for B.C. and its seven economic development regions. Three simplified steps illustrate how the B.C. labour market forecasting model works:
- Expected economic growth, industry performance and labour productivity determine labour demand.
- Demographic shifts and labour force participation drive labour supply and its components of change.
- Demand for and supply of labour in each occupation together determine labour market conditions for the occupation.
Specifically, the forecasting system is composed of three sets of regional models: macroeconomic models, industry employment models and occupational models. The combined results of the regional models generate provincial forecasts.
Macroeconomic models
Each of the seven regional macroeconomic models has two main sections:
- The economic component generates industry employment estimates and forecasts; it links to the labour demand projections in the occupational model.
- The demographic component links to the labour supply projections in the occupational model.
Each regional macroeconomic model splits the entire regional economy into 15 high-level industries based on the NAICS (North American Industry Classification System) structure.
Industry employment models
Each of the seven regional industry employment models converts employment for high-level industries from the macroeconomic model into employment estimates and forecasts for 63 industries.
Occupational models
- For labour demand, each of the seven regional occupational models produces labour demand projections for 512 occupations.
- For labour supply, the seven regional models are aggregated into four regions to produce labour supply forecasts for 512 occupations; the aggregated regions are the Mainland/Southwest, Vancouver Island/Coast, Southeast (Thompson–Okanagan and Kootenay combined) and North (Cariboo, North Coast and Nechako, and Northeast combined).
A full description of the methodology is available on the Labour Market Information Council website.
Occupational skills clustering methodology
In this report, rather than report on each skill individually a different perspective is presented by clustering the skill variables. This approach was motivated by the high correlations observed among skills in previous analyses, which indicate that many skills tend to co-occur across occupations. By applying statistical clustering techniques, the analysis identifies groups of skills with similar usage patterns and attributes. The average importance score of the skills within each of the five clusters serves as a representative summary of that group’s overall characteristics. This method simplifies the data structure and enhances interpretability, enabling a more meaningful analysis of skill demands across the labor market.
High opportunity occupation methodology

British Columbia’s High Opportunity Occupation (HOO) lists are developed to highlight jobs with strong employment prospects. Each occupation is assessed using seven labour market indicators, three that measure current conditions and four that forecast future opportunities. These indicators are weighted by their relevance: current conditions contribute 30 percent to the total score, while future projections account for 70 percent. Some indicators reflect both demand and supply dynamics, while others focus exclusively on demand.
Each occupation is scored according to its ranking across seven labour market indicators, with individual scores weighted to reflect their relative impact on labour market outcomes. Once all scores are calculated, occupations are ranked and the top 125 are identified as High Opportunity Occupations.
To ensure regional representation, separate HOO lists are created for each of British Columbia’s seven economic development regions. While the regional methodology aligns with the provincial approach, additional criteria are applied to reflect the smaller labour markets. One key constraint is that the total number of job openings for HOO occupations must not exceed 50 percent of all job openings in the region. If the initial list exceeds this threshold, the number of occupations is reduced until the cumulative job openings fall below the 50 percent cap.
To learn more, review the complete HOO lists in the BC Data Catalogue.
| HOO methodology revision The 2025 edition introduces a key update by replacing the ratio of total job openings to employment with the ratio of replacement job openings to employment. The inclusion of this measure places more weight on occupations where older workers are more prevalent and, therefore, at a higher risk of retiring. The forecasted replacement rate is weighted at 15 percent, reflecting its importance in capturing retiree-driven labour needs. Additionally, several other indicator weights have been revised. The weight for forecasted number of job openings has been reduced from 20 percent to 10 percent. The impact of this change is to reduce the weight assigned to occupations with many job openings, as this is sometimes simply a result of having a large number of people in the occupation. Meanwhile, the weight of the forecasted unemployment rate has been increased from 20 percent to 25 percent, highlighting labour market tightness as a critical factor in evaluating opportunity. |
B.C. Labour Market Outlook: 2025 Edition
Review the B.C. Labour Market Outlook: 2025 Edition forecast in the complete report (PDF).